
I thought this was cool enough to post...
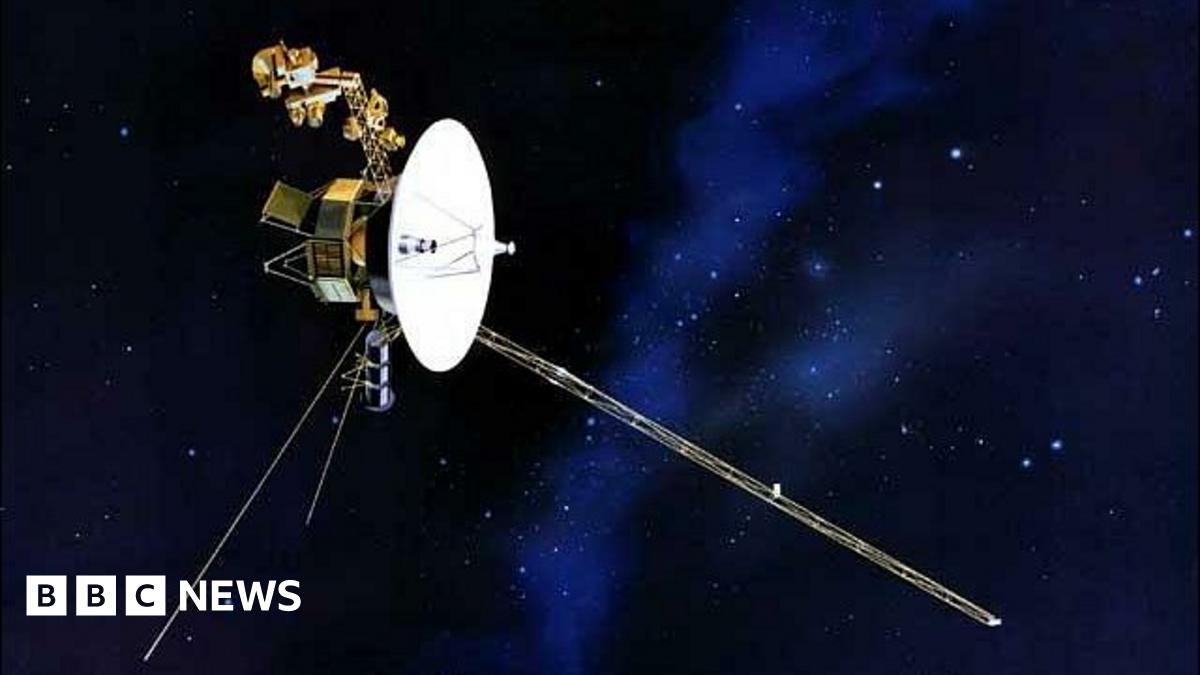
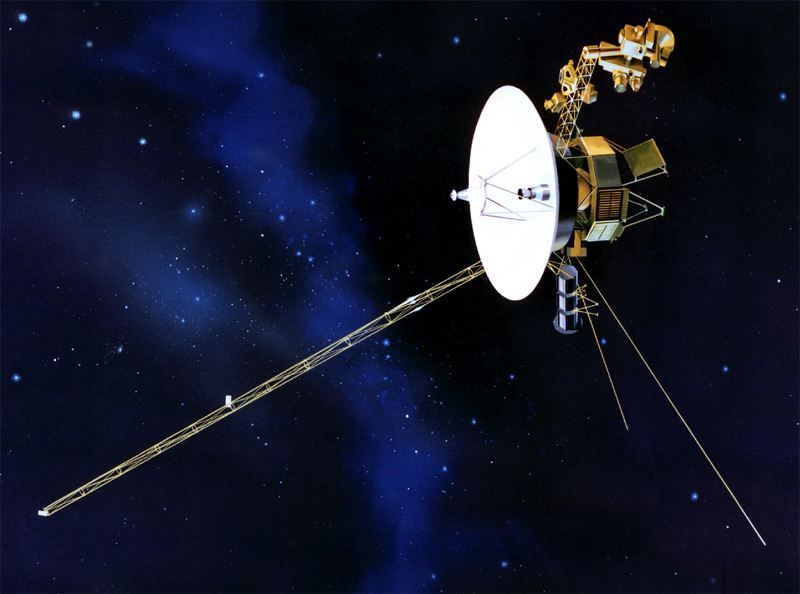
For those that don't know....we launched this little spacecraft 34 years ago, and flung it out into space...It's been traveling at 38,000 mph.....for 34 years.....and is almost 11 billion miles from Earth.


Included on the space craft is a gold record. It has the sounds of earth on it, and directions on how to find the planet earth. http://en.wikipedia.org/wiki/Voyager_Golden_Record


It's also got this song on it


For those that don't know....we launched this little spacecraft 34 years ago, and flung it out into space...It's been traveling at 38,000 mph.....for 34 years.....and is almost 11 billion miles from Earth.
Included on the space craft is a gold record. It has the sounds of earth on it, and directions on how to find the planet earth. http://en.wikipedia.org/wiki/Voyager_Golden_Record
It's also got this song on it
It was included on the Voyager Golden Record as an expression of human loneliness (awesome), and it’s a fitting soundtrack for Voyager on this endless, solitary journey.
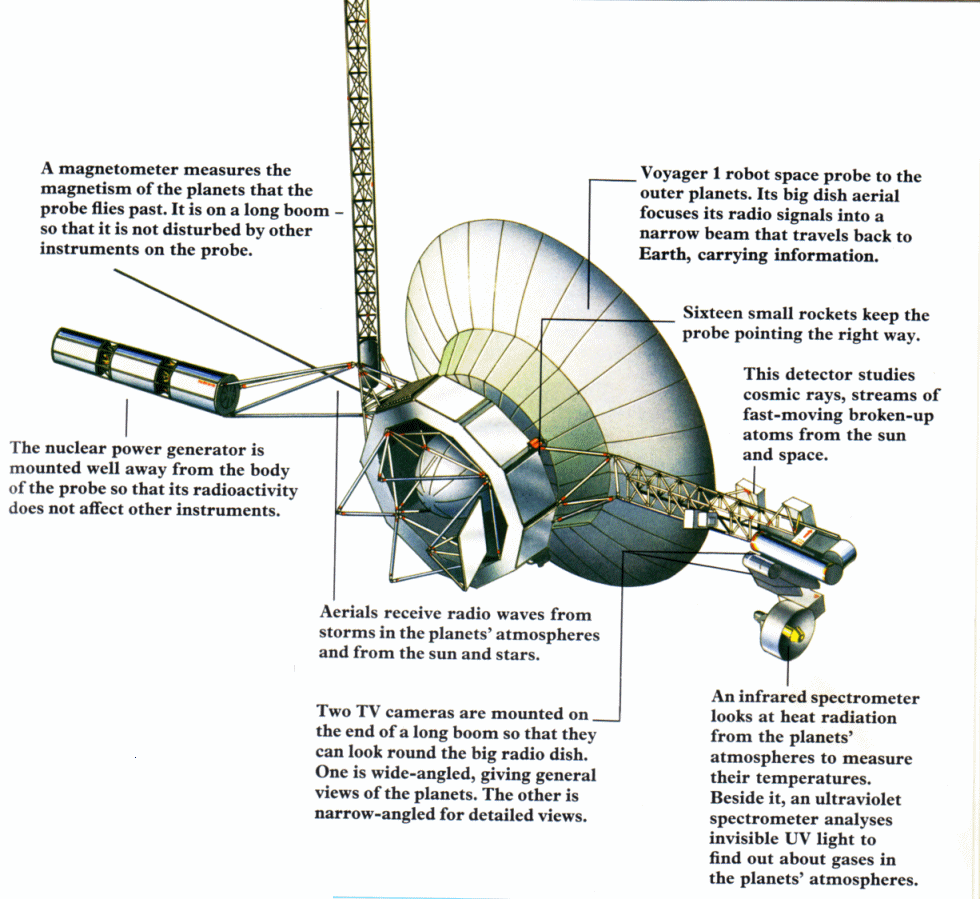
The twin Voyager probes are currently poised on the brink of interstellar space. Both are immersed in the foamy walls of the transparent “heliospheric bubble,” where the solar wind, consisting of particles blown off the Sun, stalls against the stellar winds that permeate the rest of the galaxy. Astronomers don’t know how thick the bubble walls are—that’s for the Voyagers to ascertain—but they expect the probes to burst free and begin reporting from the great beyond within the next three years. This final phase of the probes’ scientific mission should last until around 2020 to 2025, when their plutonium power sources will falter and their radios fall silent.
Thereafter the Voyagers will wander forever among the stars, mute as ghost ships but with stories to tell. Each carries a time capsule, the “Golden Record,” containing information about where, when and by what sort of species they were dispatched. Whether they will ever be found, or by whom, is utterly unknown. In that sense, the probes’ exploratory mission is just beginning.
Having played an incidental role in the mission, as producer of the Golden Record, I attended the first launch, on August 20, 1977—Carl Sagan embracing me and shouting, “We did it!” over the rolling thunder of the Titan-Centaur rocket as it climbed into a blue Florida sky atop a roiling pillar of smoke


 This is a top-down view of the Voyager record showing the stylus cartridge in place to play the disc. The position of the cartridge implies the record groove is to be played from the outside in. The symbols around the periphery of the record are a binary representation of the time required for one revolution of the record where a binary 0 is represented by a dash and a binary 1 is represented by the same vertical symbol used with the hydrogen transition above. Since leading 0's are meaningless in the binary numbering system, the number would be read off in a counter clockwise direction starting above the stylus cartridge. This also implies the record is supposed to spin clockwise relative to a stationary stylus, as that's the way the illustration needs to move to read off the binary number. The number around the periphery is 100110000110010000000000000000000 which converts to 5,113,380,864 in decimal. Multiplying this by 7.04024183647E-10 seconds yields 3.5999 seconds, the length of time for one rotation of the record.
 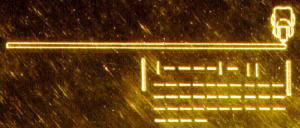 This is a side view of the record and stylus cartridge, with two large bars enclosing a binary number indicating the length of time required to play one side of the record. Doing the math again, we have 1000010110000000000000000000000000000000000 which converts to 4,587,025,072,128 in decimal. Multiplying by 7.04024183647E-10 seconds yields 3229.377 seconds, or about 53.8 minutes to play one side.
 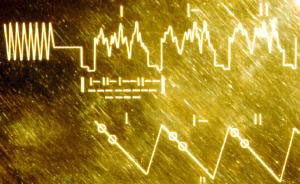 These waveform representations of the picture signal recorded in the groove provide an explanation for how the images are to be constructed. Someone analyzing the signal on the record would be able to recognize the image portion by similar looking groups of waveforms, with each group preceded by the symmetrical waveform seen in the top left corner of this picture. Each of these groups would be further subdivided into 512 individual signals, the first three of which are shown here labeled in binary notation as 1, 10, and 11 (decimal 1, 2, and 3). Just below the waveform drawing is a conceptual drawing of what they represent, again labeled 1, 10, and 11. The conceptual drawing indicates that each of the three signals represents a "line" of the final image with each line being drawn in a staggered, non-overlapping fashion. All 512 signals taken together constitute a single image. This staggered line image is the same way television images are drawn by the electron gun inside the CRT, except in the case of modern TV the lines are arranged horizontally and interlacing is used. There is also a binary number of 101101001100000000000000 under signal 1 which converts to 11,845,632 in decimal. Multiplying this by the constant of 7.04024183647E-10 seconds yields 0.0083396 seconds. So it takes about 8 milliseconds to draw one line of an image. It might be a considerable jump for someone to look at this one portion of the record cover and interpret what the image waveforms are supposed to be, but the two images below it provide further reinforcement of the desired interpretation.
 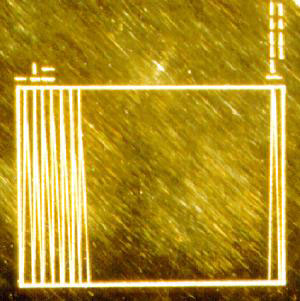 This drawing expands on the concepts presented in the waveform drawing by showing what a complete image would look like. There's a binary number 1000000000 drawn vertically above the last line of the image. This converts to 512 in decimal and indicates that the image consists of 512 lines, which would concur with the 512 similar signals within each waveform as described above. There is also a binary number of 10000 at the left end of the picture that converts to decimal 16. The interpretation of this seems somewhat cryptic, but it means that there are 16 levels of gray within each line. In other words the image quality in terms of grayscale is about equal to a photocopy of a photograph. The image quality in terms of resolution would be somewhat less than a photocopy as it equals about 500 dots along each line of the image. Thus each image has about the same number of dots along each line as there are lines in the complete image. If you think in terms of pixels rather than lines, this ratio results in square pixels.
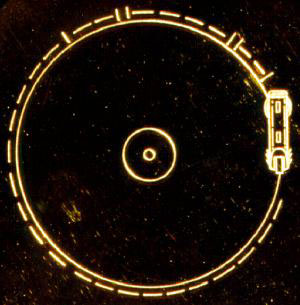
 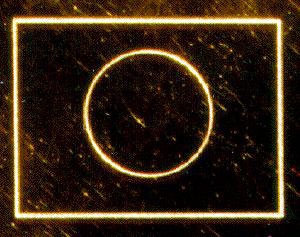 This picture of a circle is the first image recorded on the record. It is intended for calibration purposes to ensure the signal on the disc is being decoded properly, and the right ratio of horizontal to vertical height is used in picture reconstruction. For example, if someone decoded this picture and the circle instead looked like an oval that was wider than it was tall, they would probably guess that they need to draw the picture lines closer together.
 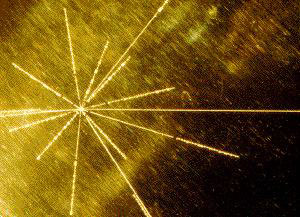 This picture has nothing to do with interpreting the disc contents, but rather is a pulsar map indicating the solar system from which the Voyager spacecraft originated. The cover of the Voyager record also contains an ultra-pure source of Uranium-238 to serve as a radioactive clock for determining the record's age. This same pulsar map as well as hydrogen atom drawing were also included on the
 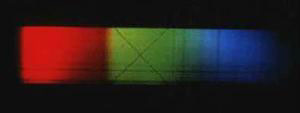 The Voyager record contains about 20 color pictures, and at first it might seem a mystery how these could be extracted from 16 levels of gray. This picture of the solar spectrum is the first color image on the record, and someone recovering the image would note that it is actually recorded on the record three times in succession, with only the gray levels being different between the three recordings. The black absorption lines extending through the rainbow pattern are distinct for any G2 star like our own sun. A civilization familiar with solar spectroscopy should be able to recognize this as the red, green, and blue portion of a solar spectrum. They should then realize that the color image can be reconstructed by making a composite of the three images, one on top of the other, with the 16 shades of gray being interpreted as 16 shades of red, green, or blue in each layer of the image. By adjusting the color values assigned to each shade of gray, they will be able to reconstitute this known image of a solar spectrum and then use those color settings to properly view the remaining color images on the record. This is the same RGB technique used with present-day computers to determine exact colors. Sixteen levels of gray corresponds to 4 bits (2 to the fourth power), so the color images on the Voyager record have a combined color depth of 12 bits which permits a total of 4096 colors (2 to the twelfth power). By comparison, a common color setting for web browsing is 16-bit or 65,536 colors, and most computers manufactured today can do 32-bit color.


Comment