Announcement

Collapse
No announcement yet.

Global Warming is over.

Collapse
X
 
  • Filter
  • Time
  • Show
Clear All
new posts

    Originally posted by gwb72tii View Post
    what it all apparently means is this rwh
    CO2 is apparently not THE driver of global warming, that man's understanding of climate is insufficient to explain cause and effect of anthro souces of GHG, that previous predictions of gloom and doom are wrong
    George, I really have a hard time figuring out if you just constantly try to build strawmen or are actually going senile before our eyes. Either way, most people understand that global temperature is a result of multiple factors, not just CO2. And with that, other influences can change the temperature, even if there remains a GHG-based forcing that increases the temperature from what it would have been based solely on the other, natural factors.

    Let's rewind and go back to another time you've tried to use this simpleton's approach:

    Originally posted by rwh11385 View Post
    Anyway, to respond the the argument that you leaned on several times...

    Although apparently you forgot that the "warming had stopped" rebuttal had been mentioned before.


    Just like the cherry picking you usually do, using one high data point to focus comparison against while ignoring the large overall trend is misleading. 1998 made it possible to average out a flat line, even if:

    "We know the planet is absorbing more energy than it is emitting," said GISS Director James E. Hansen. "So we are continuing to see a trend toward higher temperatures. Even with the cooling effects of a strong La Niña influence and low solar activity for the past several years, 2011 was one of the 10 warmest years on record."

    The difference between 2011 and the warmest year in the GISS record (2010) is 0.22 degrees F (0.12 C). This underscores the emphasis scientists put on the long-term trend of global temperature rise. Because of the large natural variability of climate, scientists do not expect temperatures to rise consistently year after year. However, they do expect a continuing temperature rise over decades.

    The first 11 years of the 21st century experienced notably higher temperatures compared to the middle and late 20th century, Hansen said. The only year from the 20th century in the top 10 warmest years on record is 1998.


    And guess wait a couple of years and see if this prediction pans out...
    Hansen said he expects record-breaking global average temperature in the next two to three years because solar activity is on the upswing and the next El Niño will increase tropical Pacific temperatures. The warmest years on record were 2005 and 2010, in a virtual tie.

    "It's always dangerous to make predictions about El Niño, but it's safe to say we'll see one in the next three years," Hansen said. "It won't take a very strong El Niño to push temperatures above 2010."
    So even though there were elements in nature that should have influenced the climate cooler, warm temperatures were still found. What do you think will happen if those factors turn back to normal? It seems that Hansen at least expects new records coming.


    What is insufficient is your grasp of science George. And lack of ability to state your case for why the planet can absorb more energy than it emits and that this energy somehow disappears??? Anyone with the most basic understanding of science knows that energy cannot be created nor destroyed - yet for some reason the deniers seem to assume it possible because the implications of such reality might negatively impact coal or oil companies.


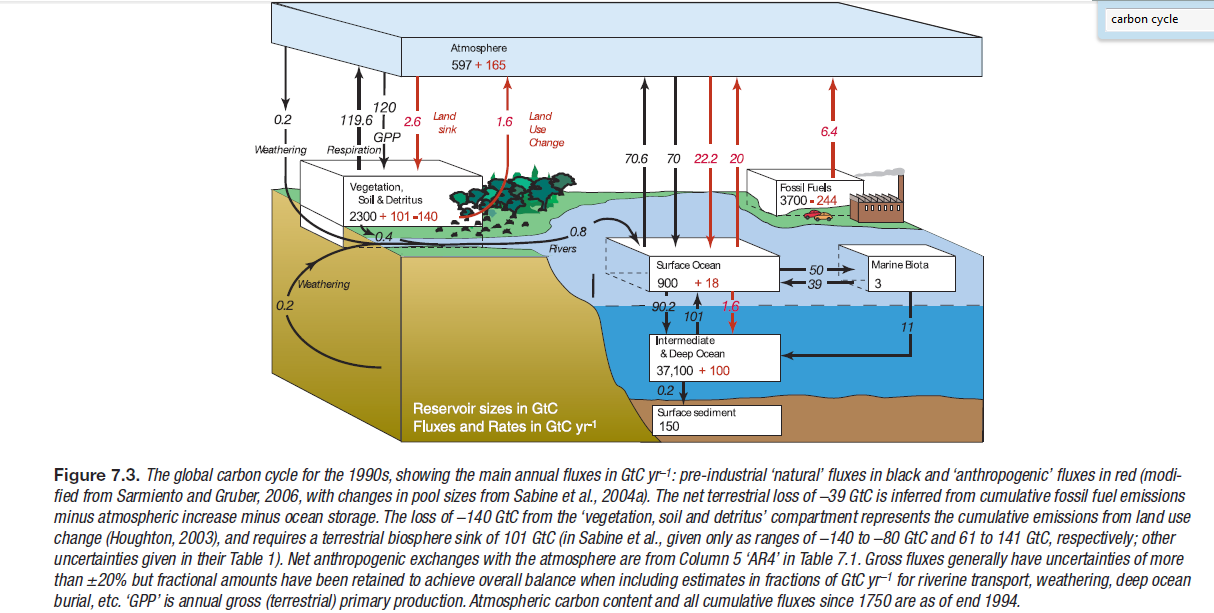
    Maybe you chose to ignore the information about the deep ocean heating, but finding nearly a third of ocean's heat that was previously not accounted for seems pretty important. That may have thrown off the correlation of land surface temperatures but still represents GHG influence on the global environment and should help refine the models in the future. This would not have been possible without the investment and data collection to support such. Likewise, accounting for variable intake of CO2 by plankton can help revise models as well. The key is to use science and research to explain the world around us and understand the impact of our decisions - instead of acting in complete and utter ignorance.

    Comment


      Originally posted by BraveUlysses View Post
      non sequitur actually
      A non-sequitur trying to setup a straw man ;)
      Need parts now? Need them cheap? steve@blunttech.com
      Chief Sales Officer, Midwest Division—Blunt Tech Industries

      www.gutenparts.com
      One stop shopping for NEW, USED and EURO PARTS!

      Comment


        Originally posted by gwb72tii View Post
        do you see a correlation in this graph?


        I see that you have decided to update the thread with today's post from Anthony Watts instead of explaining why you think that energy can be destroyed somehow: http://wattsupwiththat.com/2013/04/0...worry-go-awol/

        Why do you pay attention to that guy? Is it his ties with Heartland - your go to source for science? Or that he didn't graduate from college? Or


        Does drawing a flat line make it true?
        Oh the irony. A post by Anthony Watts at WUWT claims to be a “fact check” about ocean heat content. Alas, Willard Tony didn’t check his “facts.”


        Sure looks like a pause to me, especially after steep rises in OHC from 1997-2003. Note the highlighted period in yellow:


        As for Watts’ choice of start year, I’m tempted to say it’s a blatant cherry-pick. That’s when you pick the data because it gives you what you want.We already know that cherry-picking is child’s play.

        But it’s not really cherry-picking at all. It’s rotten-tomato picking. Then he calls the rotten tomato a cherry.

        Let’s give the baby his bottle. Go ahead, use the PMEL data. Go ahead, leave out ocean heat content below 700 meters (even though we have data down to 2000 meters). Go ahead — start with 2003. Let the baby have everything he picked himself.

        Then let’s look closely at his “Sure looks like a pause to me” claim.

        Here’s the data — ocean heat content anomaly for the upper 700 meters only, according to PMEL, leaving out everything prior to 2003 — together with that lovely yellow line which Willard Tony added to make it look more like a “pause”:


        But drawing a flat line doesn’t make the trend a flat-line. We could estimate the trend by least-squares regression. Or, we could estimate it by Theil-Sen regression. Or, we could use another robust method called L1 regression. These methods, these quantitative statistical methods, the ones that gives us some clue beyond “sure looks like … to me” — what would they tell us?

        Graphically, they tell us this:


        Numerically, they tell us that the upward trend — the warming of the top 700 meters of the world’s oceans — the trend that shows “pause” to be a lie — is statistically significant. According to all of them.

        It’s quite likely that Willard Tony didn’t bother to compute these. That he didn’t bother to compute anything at all. He just said “Sure looks like a pause to me,” and drew a flat line.

        This is the problem with today’s discussion of global warming. The fake “skeptics” of global warming do this all the time. It’s their modus operandi. Cherry-pick the data, include only what gives you what you want because it gives you what you want. If you must do some actual analysis, keep trying different data sets and different time spans until you get what you want. Or, don’t even bother doing any analysis at all. Just say “Sure looks like,” draw a flat line, and declare it to be a “fact-check.”

        This is the pathetic standard to which they hold themselves.
        And that's not even including the data from below 700m which holds 30% of the heat increase...

        But keep reading what you want to hear instead of actually caring about science or facts... it helps point out that you are tinfoil denier guy.

        Comment


          haha
          so you deny the empirical evidence
          i thought you'd appreciate statistics showing no warming since your a stat guy

          but then you're smarter, science wise, than any of the data
          haha
          “There is nothing government can give you that it hasn’t taken from you in the first place”
          Sir Winston Churchill

          Comment


            Originally posted by gwb72tii View Post
            haha
            so you deny the empirical evidence
            i thought you'd appreciate statistics showing no warming since your a stat guy

            but then you're smarter, science wise, than any of the data
            haha
            Wait. Do you have a complete and utter lack of reading ability? Or only see what you want to?

            Comment


              no, your charts show the same thing, a lack of warming since the late 90's
              “There is nothing government can give you that it hasn’t taken from you in the first place”
              Sir Winston Churchill

              Comment


                Troll of the century...

                Comment


                  Originally posted by gwb72tii View Post
                  no, your charts show the same thing, a lack of warming since the late 90's
                  Are you sure? Can you read? Are you positive that it doesn't show that Anthony Watts cherry picks charts by excluding data and then throws an non-statistical / non-scientific flat line where actual statistical regressions show a rise even when 30% of the heat is excluded?

                  And yet, because of your clearly poor understanding of this subject, you believe that stats show somehow no warming?

                  If it wasn't so sad, it'd be hilarious. There's nothing funny about ignorance like yours. Mostly because there's elected politicians that think (or don't think) like you.

                  Comment


                    SOURCES:16" Interview with Michael Coren23" Interview on Australian TV program 'Sunrise' 200936" "Climate Chaos? Don't believe it."Sunday Telegraph Nov 5, 20...


                    This video details how professional deniers manipulate their credentials and the data. If you have time you should watch the whole series on Lord Monckton, and if you have more time you should watch his whole series on climate change. I've been following this guy for a few years and he always does an incredible job debunking the claims of "skeptics" and actually focusing on the science.

                    Comment


                      So here is a complicated question for the skeptics:

                      Based on measurements we know that humans are emitting co2 faster than the earth can naturally re-absorb it. This leads to a measurable net increase in atmospheric carbon each year.


                      The 'pro global warming camp' says that these 'extra' emissions will change the atmosphere in a way that makes the earth warmer, and the 'anti global warming camp' says that it will not have an effect on temperature.

                      Based on the 20 years, it seems that global average temperatures have remained steady or gone down even though total atmospheric carbon continues to rise.


                      However, based on the last 50 years the correlation between temperature and co2 seems obvious.


                      Why should we discount the data from the last 50 years in favor of the data from the last 20 years? Why are you ignoring a low solar cycle and a la nina cycle in 2008 that typically drops atmospheric temperatures by .1C and is easily observable on the graph above? Do you believe this cycle will continue to remain steady even though global temperatures over the last 50 years it have been increasing?

                      Wiki link to la-nina cycles that follow the 'low cooling points' on the temp graph: http://en.wikipedia.org/wiki/La_Ni%C3%B1a

                      Why have you also decided to ignore research into atmospheric forcings of global temperature? Do you believe this research is flawed?


                      Net forcing research since 1930s seems to give a reasonably accurate picture of an increase in global temperature based on the above factors. The red line being the actual temperature and the blue line being forcing factors. Why do you believe this model is incorrect?
                      Last edited by Q5Quint; 04-08-2013, 07:18 AM.

                      Comment


                        Originally posted by herbivor View Post
                        $1000 a year on 2300sf seems high for a house so tight unless that includes electricty use in addition to heating and cooling. Don't understand why only R-20 in the roof (5.5" open cell) since Code is R-38? Up there, unless you had 2" EPS on top of the roof deck as well. Anyway, the "energy guru" is Harry Boody with Energy Innovations. he's not a ME, but may as well be. Do you know the guys at Home Energy Partners, Isaac Savage? Sounds like you do what he does. He built Straw bale houses out west before starting his company about 10 years ago. Glad to see you're into this stuff. If only the public was a little more knowledgeable about it.
                        .50 cents per sq foot per year is easily achievable without going into passivehouse super-insulation territory. At that point your 'other' loads use more energy than your heating and cooling loads. We have worked with Isaac before, and some of his former employees at the Western NC green building council- they are our leed certification providers. I used to work for a mechanical design company but now I do structural.... since most residential folks never hire a mech engineer (just let the hvac guy use a rule of thumb, right?) but they all need a good foundation.

                        On that house above we modeled $258 per year heating, $69 cooling, and $45 hot water. That plus about $700 of 'other lights and appliances'.

                        HERS index of 47 which means 53% better than required code. (I believe 2003-4 iecc). You *could spend more on insulation and do the roof deck foam.....but going back and looking at the pictures it looks like she already filled the whole rafter, floor and wall cavities to the max with open cell, so at a savings of maybe $40-$50 a year the payback gets a little wonky with the added cost.

                        www.BuildingScience.com is probably the website I reference the most for energy stuff. Vapor drive and drying direction are way more important than energy... since they can mold your hose down.... but most people don't think about it since we live in houses leaky enough to have a door and window open 24/7 all year long.

                        Comment


                          Originally posted by Q5Quint View Post
                          Why do you believe this model is incorrect?
                          Because basing arguments off of ignorant selective viewing of trends validates their beliefs. I've pointed out this flaw several times to GWB albeit not as in depth as you, yet he time and time again chooses to ignore that you need to view the overall trend and prefers to base his arguments off of windows which confirm his ignorances.

                          By his logic warming should have stopped after the 70's because there was a pause then as well, but here we are with higher temperatures that coincidently coincide with c02 emissions.

                          At least the organizations and individuals he likes to refer to have something to gain from spreading their propaganda, they're paid damn well to do so. The only thing the likes of himself and Fusion stand to gain is a few laughs in their direction.

                          Comment


                            Originally posted by cale View Post
                            Because basing arguments off of ignorant selective viewing of trends validates their beliefs. I've pointed out this flaw several times to GWB albeit not as in depth as you, yet he time and time again chooses to ignore that you need to view the overall trend and prefers to base his arguments off of windows which confirm his ignorances.

                            By his logic warming should have stopped after the 70's because there was a pause then as well, but here we are with higher temperatures that coincidently coincide with c02 emissions.

                            At least the organizations and individuals he likes to refer to have something to gain from spreading their propaganda, they're paid damn well to do so. The only thing the likes of himself and Fusion stand to gain is a few laughs in their direction.
                            wow
                            so now the data that feeds the IPCC (did you know the IPCC is a political organization, not a scientific org?) is somehow misleading? that actual data cannot be referenced in any anttempt to question your deeply held faith?
                            i posted data from independent sources, and as i was typing i was wondering about how even the data would be rejected by you and members of the AGW cult.

                            and Q5, why stop at 50 years, which conveniently misses the global cooling period just before it (yes, with CO2 rising)? why not go back further, eons ago, when atmospheric CO2 was multiples higher than today and global mean temps were lower?
                            “There is nothing government can give you that it hasn’t taken from you in the first place”
                            Sir Winston Churchill

                            Comment


                              The stupidity continues, no sense in repeating myself if you're incapable of comprehending your own misunderstandings. I'll leave you to it and chime in if you present anything new.

                              Comment


                                Originally posted by Q5Quint View Post
                                .50 cents per sq foot per year is easily achievable without going into passivehouse super-insulation territory. At that point your 'other' loads use more energy than your heating and cooling loads. We have worked with Isaac before, and some of his former employees at the Western NC green building council- they are our leed certification providers. I used to work for a mechanical design company but now I do structural.... since most residential folks never hire a mech engineer (just let the hvac guy use a rule of thumb, right?) but they all need a good foundation.

                                On that house above we modeled $258 per year heating, $69 cooling, and $45 hot water. That plus about $700 of 'other lights and appliances'.

                                HERS index of 47 which means 53% better than required code. (I believe 2003-4 iecc). You *could spend more on insulation and do the roof deck foam.....but going back and looking at the pictures it looks like she already filled the whole rafter, floor and wall cavities to the max with open cell, so at a savings of maybe $40-$50 a year the payback gets a little wonky with the added cost.

                                www.BuildingScience.com is probably the website I reference the most for energy stuff. Vapor drive and drying direction are way more important than energy... since they can mold your hose down.... but most people don't think about it since we live in houses leaky enough to have a door and window open 24/7 all year long.
                                Ah, that is impressive energy savings. I'm very familiar with Mr. Lstiburek. Good stuff. I also do structural, residential mainly. What are your thoughts on solar in NC? A neighbor down the street intstalls at $4 per watt. He says fed pays 35% and state pays 30% (until they kill that incentive at the end year). So a $30k , 7.5kwh system costs the consumer $10,500 after tax credits. That doesnt include the added value to the house. Sounds pretty good. What am I missing?
                                sigpic

                                Comment

                                Working...
                                X