Originally posted by gwb72tii
View Post
Why not use all the data available? And why worry about data sets when you don't understand the most basic concepts of statistics and want to draw a trend that isn't based on any math but rather strictly what you want to see.
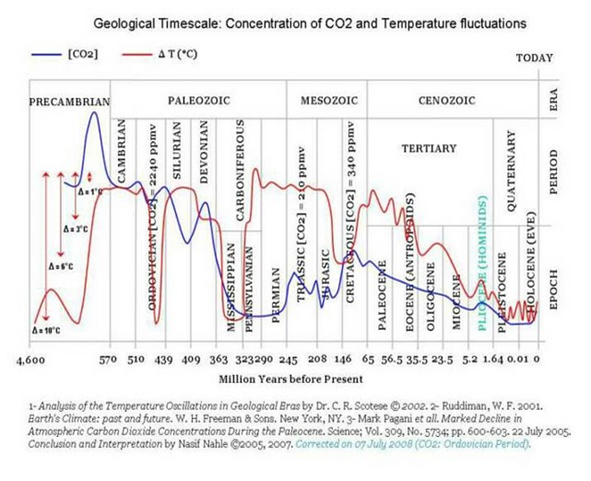
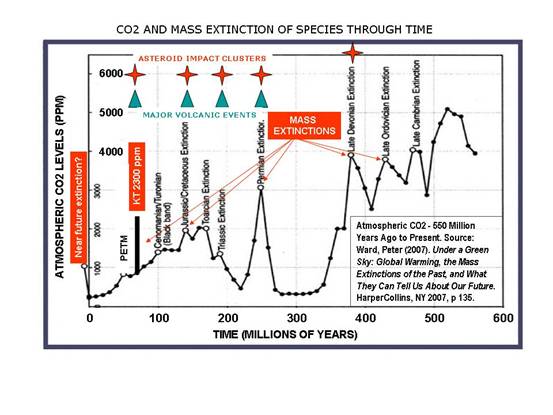
When was CO2 at multiples of today? Because this chart doesn't seem to have the same "reality" that you seem to believe in:

But I mean, NASA and NOAA are just scientific organizations where I think pretty much everyone actually graduated from college unlike Anthony Watts.
Important to review what you seem to want to ignore:
Certain facts about Earth's climate are not in dispute:
The heat-trapping nature of carbon dioxide and other gases was demonstrated in the mid-19th century.2 Their ability to affect the transfer of infrared energy through the atmosphere is the scientific basis of many JPL-designed instruments, such as AIRS. Increased levels of greenhouse gases must cause the Earth to warm in response.
Ice cores drawn from Greenland, Antarctica, and tropical mountain glaciers show that the Earth’s climate responds to changes in solar output, in the Earth’s orbit, and in greenhouse gas levels. They also show that in the past, large changes in climate have happened very quickly, geologically-speaking: in tens of years, not in millions or even thousands.3


Comment