
It's not the changing of the argument, it is a direct question to you about your interpretation of unemployment charts. Isn't that the subject at hand?
Trying to say I'm like a girl because I ask questions you don't want to or cannot answer is a weak move. It shows how desperate you are to 'argue' when you are crippled by bias and lack any logical reasoning ability.
Yup. He's a clown, mixed with some elements of McCarthyism. "If you don't see the world as I see it with my biased eyes, you are the enemy"
-
there's no argument, you're using the same flawed reasoning here as you were in the "no warming in 16 years" chart. From when U6 peaked in 2009 to present it has decreased, has it not? was the cause of the financial crisis 10 years of disasterous GWB policies or did Obama cause it 3 months before taking office?Leave a comment:
-
-
congratulations rwh
and people wonder how economists are never right LOL
so now going from 14.2 to 14.7 on U6 is a decrease?Leave a comment:
-
Here's a simple question, if you want to be so simple-minded to only look at a chart and single statistic, would you re-elect this president or not?

Leave a comment:
-
I'm not voting for Obama, you simple-minded old fart. I know it is not possible for you to comprehend that some people's desire for truth and reason are above any desire to mislead people in support of the preferred candidate. But you obviously are comfortable with misleading people. You do it for a living. And that is also why you like Fox News and other bullshit sources that put information that they like and want to spread above honesty or accuracy.
How did Obama dig the hole deeper? Please explain that. That there was still job losses from the recession when he took over, even if they reduced since his entry and turns in the same year to job growth?
Your? or Youre? Is is? Anyway, I was able to find my way around Europe fine the times I visited, but it's funny that you are trying to talk down about someone else's sense when you have absolutely none - or talking shit about some random person to insult me. Pathetic.
You made a statement about U6 not improving since 2009, not mentioning the first time that you wanted to try to cherry pick since OB took over and inherited the shit you and buddies on wall street made. "Oh trust me, this is a good investment, I've been doing this for 25 years and you haven't"Leave a comment:
-
go ahead and pull the lever for the messiah rwh, be my guest
obama dug the freaking hole deeper, and it is testament to the fact your an economist with his head in the books and no common sense
in fact your very similar to a friend we went to europe with. he's brilliant, a phd botanist, but cannot read a map or figure out where is is.
i made a simple statement. U6 is where it was at in 09. you proved me right and then tried to change the argument, as you do with others.Leave a comment:
-
No I showed that you are a pathetic close-minded RWNJ who doesn't care about reason.
Were the months of job losses when Obama took office his fault? Or the result of the crisis from years of pushing people into homes and FAs promising their clueless clients that mortgage-backed securities were a good investment so they could make a buck.
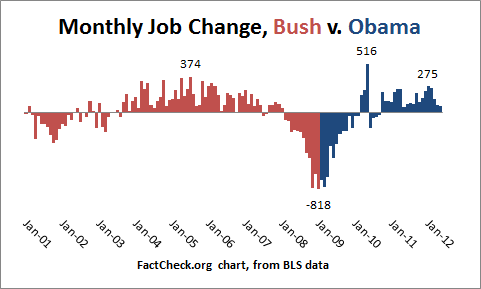
Since Jan 2009, the losses turned into job growth and U6 has steadily been reduced since its peak. GWB's last month was at the peak for job losses and although 2009 saw reductions in job losses, more people losing than gaining means generally a worse unemployment rate. Once it became positive, job growth has been slow and steadily improving unemployment numbers. But the hole dug - Obama didn't build that. Although the economy since then has been pulling us all out of it since then.
I know that takes more advanced thinking than you are capable of but being a simpleton doesn't mean you are going to convince others to think on your lowered level.Last edited by rwh11385; 10-21-2012, 12:34 PM.Leave a comment:
-
thank you for showing i'm right, LOL
what i see is a start in 2009 of 14.2, and today the latest is 14.7
http://portalseven.com/employment/un...nt_rate_u6.jsp
so basically, the economy is shit and there has been no job creation since the messiah took his throneLeave a comment:
-
Come on. Do you want to accurately portray reality, or be like fox news?
Yeah, you can be close-minded and stubborn to try to judge from a chart that it has increased since 'where 2009 would be' or even could ACTUALLY LOOK AT THE DATA to find the single month in 2009 that was lower than today (which was January... when the full effects of the recession wasn't yet felt). But, you said:
Since means in the time after 2009, and during 2009 was the rise as mentioned and the peak. Parts of 2008 weren't even that high compared to peak. So clearly you can take numbers out of context, but doesn't fairly represent reality.
Sorry U6 isn't where it was before the recession yet, or where it was in 2009 before the largest losses of employment, but it is improved from its 2009 peak and has improved since where it was at the end of 2009... regardless of how absolutely blinded you are by hatred for the administration so you can't even objectively understand anything.2008-01-01 9.2
2008-02-01 9.0
2008-03-01 9.1
2008-04-01 9.2
2008-05-01 9.7
2008-06-01 10.1
2008-07-01 10.5
2008-08-01 10.8
2008-09-01 11.1
2008-10-01 11.8
2008-11-01 12.7
2008-12-01 13.5
2009-01-01 14.2
2009-02-01 15.1
2009-03-01 15.7
2009-04-01 15.8
2009-05-01 16.4
2009-06-01 16.5
2009-07-01 16.5
2009-08-01 16.7
2009-09-01 16.8
2009-10-01 17.2
2009-11-01 17.1
2009-12-01 17.1
2010-01-01 16.7
2010-02-01 16.9
2010-03-01 16.9
...
Yes, there's a long way to get back to 8% U6, but being completely ridiculous all the time with total disregard for reason won't help.Leave a comment:
-


Leave a comment: